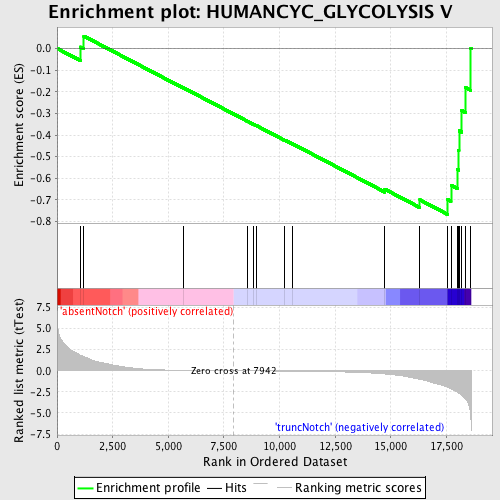
Profile of the Running ES Score & Positions of GeneSet Members on the Rank Ordered List
| Dataset | Set_03_absentNotch_versus_truncNotch.phenotype_absentNotch_versus_truncNotch.cls #absentNotch_versus_truncNotch.phenotype_absentNotch_versus_truncNotch.cls #absentNotch_versus_truncNotch_repos |
| Phenotype | phenotype_absentNotch_versus_truncNotch.cls#absentNotch_versus_truncNotch_repos |
| Upregulated in class | truncNotch |
| GeneSet | HUMANCYC_GLYCOLYSIS V |
| Enrichment Score (ES) | -0.7670485 |
| Normalized Enrichment Score (NES) | -1.5286639 |
| Nominal p-value | 0.023809524 |
| FDR q-value | 0.37658748 |
| FWER p-Value | 0.997 |
| PROBE | DESCRIPTION (from dataset) | GENE SYMBOL | GENE_TITLE | RANK IN GENE LIST | RANK METRIC SCORE | RUNNING ES | CORE ENRICHMENT | |
|---|---|---|---|---|---|---|---|---|
| 1 | PKM2 | 6520403 70500 | 1058 | 1.826 | 0.0068 | No | ||
| 2 | PFKM | 1990156 5720168 | 1203 | 1.664 | 0.0570 | No | ||
| 3 | PKLR | 1170400 2470114 | 5663 | 0.050 | -0.1810 | No | ||
| 4 | ALDOB | 4730324 | 8557 | -0.010 | -0.3362 | No | ||
| 5 | ENO2 | 2320068 | 8820 | -0.015 | -0.3497 | No | ||
| 6 | BPGM | 5080520 | 8961 | -0.017 | -0.3567 | No | ||
| 7 | PGK2 | 2650091 | 10225 | -0.041 | -0.4232 | No | ||
| 8 | ALDOC | 450121 610427 | 10595 | -0.050 | -0.4413 | No | ||
| 9 | GAPDHS | 2690463 | 14730 | -0.376 | -0.6504 | No | ||
| 10 | PFKP | 70138 6760040 1170278 | 16307 | -1.017 | -0.6997 | Yes | ||
| 11 | PGK1 | 1570494 630300 | 17561 | -1.960 | -0.6987 | Yes | ||
| 12 | PFKL | 6200167 | 17705 | -2.120 | -0.6325 | Yes | ||
| 13 | ENO1 | 5340128 | 17995 | -2.530 | -0.5598 | Yes | ||
| 14 | PGAM1 | 2570133 | 18048 | -2.619 | -0.4713 | Yes | ||
| 15 | PGAM2 | 3610605 | 18065 | -2.637 | -0.3802 | Yes | ||
| 16 | TPI1 | 1500215 2100154 | 18184 | -2.852 | -0.2871 | Yes | ||
| 17 | ENO3 | 5270136 | 18352 | -3.305 | -0.1809 | Yes | ||
| 18 | ALDOA | 6290672 | 18596 | -5.593 | 0.0011 | Yes |

